This site uses cookies to improve your experience. To help us insure we adhere to various privacy regulations, please select your country/region of residence. If you do not select a country, we will assume you are from the United States. Select your Cookie Settings or view our Privacy Policy and Terms of Use.
Cookie Settings
Cookies and similar technologies are used on this website for proper function of the website, for tracking performance analytics and for marketing purposes. We and some of our third-party providers may use cookie data for various purposes. Please review the cookie settings below and choose your preference.
Used for the proper function of the website
Used for monitoring website traffic and interactions
Cookie Settings
Cookies and similar technologies are used on this website for proper function of the website, for tracking performance analytics and for marketing purposes. We and some of our third-party providers may use cookie data for various purposes. Please review the cookie settings below and choose your preference.
Strictly Necessary: Used for the proper function of the website
Performance/Analytics: Used for monitoring website traffic and interactions
Earlier this year, I was honored to give a Win Loss analysis webinar, as part of the competitive intelligence #IntelCollab series facilitated by Craig Fleisher, Chief Learning Officer at Aurora WDC. You can view the slides and listen to the webinar entitled: Win/Loss Analysis Captures and Keeps New Business. You will get a preview of my recently published book, Win/Loss Analysis: How to Capture and Keep the Business You Want.
Business intelligence and business analytics… aren’t they the same thing? Or are they describing opposite processes? There are a lot of big words that get thrown around in the world of BI, and it’s easy to get lost in a whirlwind of interpretation. Trending Terminology The diversity of opinion reflects the fluidity of how we […].
A while ago I wrote a blog post about Azure SQL Data Warehouse and Power BI which I explained how to install a new instance of Azure SQL Data Warehouse and how to visualise your Azure SQL DW data in Power BI. In this post I explain how to query an Azure SQL DW in … Continue reading Query Azure SQL Data Warehouse in SSMS and SSDT. The post Query Azure SQL Data Warehouse in SSMS and SSDT appeared first on BI Insight.
In the study, 85% of respondents indicated that end user data preparation is “important to critical” with 65% considering it “very important to critical.” Your Business Need Self-Serve , Deep Dive Analytics and BI Tools.
AI adoption is reshaping sales and marketing. But is it delivering real results? We surveyed 1,000+ GTM professionals to find out. The data is clear: AI users report 47% higher productivity and an average of 12 hours saved per week. But leaders say mainstream AI tools still fall short on accuracy and business impact. Download the full report today to see how AI is being used — and where go-to-market professionals think there are gaps and opportunities.
Click-to-cash should be the goal of any marketer looking to map their impact. But when you’re constantly bombarded with data from social media, email, CRM, and hundreds of other systems and applications, it can be hard to figure out what to track. Your lead generation metrics may be through the roof, but that doesn’t mean you’re delivering the right leads to sales. “Likes” are nice, but they don’t mean much if you can’t connect them to actual revenue.
A while ago I wrote a blog post about Power BI Publisher for Excel. Today I want to explain some new features added to the publisher. In this post you learn how to analyse Power BI data in Excel. Using the new Power BI Publisher for Excel, not only can we pin an Excel range … Continue reading Analyse Power BI Data in Excel. The post Analyse Power BI Data in Excel appeared first on BI Insight.
A while ago I wrote a blog post about Power BI Publisher for Excel. Today I want to explain some new features added to the publisher. In this post you learn how to analyse Power BI data in Excel. Using the new Power BI Publisher for Excel, not only can we pin an Excel range … Continue reading Analyse Power BI Data in Excel. The post Analyse Power BI Data in Excel appeared first on BI Insight.
What if you paid for a self-serve buffet but you were only allowed to eat the items someone else picked for you, or you could only go to certain self-serve stations, while others were off limits? You wouldn’t be happy! Especially if you had to pay full price for the experience! So, what about the world of ‘self-serve’ business intelligence?
Debunking Common Business Intelligence Myths. Myth #5: It is Expensive and Time-Consuming to Give Mobile BI to Business Users. There is no way to avoid the hype and claims swirling around the business intelligence market today. But, if your organization is trying to institute a self-serve BI initiative, choose a new BI tools solution or change from one BI solution to another, it must first debunk the myths surrounding the market and dispense with the market hype.
Like many energetic sales leaders, when Domo’s VP of Corporate Sales Jeff Skousen starts his day, it’s with a workout—and in his case, that typically means a long mountain bike ride. But before he even gets on the trail, Jeff kicks off his day by looking at 5 “hot” metrics that are front and center in his Domo app. This helps him to take immediate action on both potential issues and opportunities to help his growing sales team close deals more effectively.
ElegantJ Bi is pleased to announce the release of version 4.3 of the ElegantJ BI Business Intelligence and Corporate Performance Management (CPM) suite. The release of ElegantJ Bi v4.3 represents another step on the path to enhanced self-serve BI tools to support the transition of business users to true citizen data scientists. The ElegantJ BI version 4.3 release includes major features and enhancements.
Speaker: Jay Allardyce, Deepak Vittal, Terrence Sheflin, and Mahyar Ghasemali
As we look ahead to 2025, business intelligence and data analytics are set to play pivotal roles in shaping success. Organizations are already starting to face a host of transformative trends as the year comes to a close, including the integration of AI in data analytics, an increased emphasis on real-time data insights, and the growing importance of user experience in BI solutions.
As the business intelligence solution market evolved, many enterprises struggled to determine and establish the best use for these tools. In the beginning, BI tools were isolated to users in the analyst or IT community where reports and analysis were produced on request. This information was shared with executives and senior managers, and was not accessible to business users or financial, accounting or auditing professionals within the organization.
A while ago I wrote a blog post about Azure SQL Data Warehouse and Power BI which I explained how to install a new instance of Azure SQL Data Warehouse and how to visualise your Azure SQL DW data in Power BI. In this post I explain how to query an Azure SQL DW in … Continue reading Query Azure SQL Data Warehouse in SSMS and SSDT. The post Query Azure SQL Data Warehouse in SSMS and SSDT appeared first on BI Insight.
Corporate collaboration in the digital age. Sure, your business data is important. But data alone is only half the equation. You rely on people— your people and the people who work alongside you—to provide the context and insights you need to make smarter, data-driven decisions. But collaboration isn’t always easy, particularly when your conversations are unhinged from the data you need to talk about.
A while ago I wrote a blog post about Power BI Publisher for Excel. Today I want to explain some new features added to the publisher. In this post you learn how to analyse Power BI data in Excel. Using the new Power BI Publisher for Excel, not only can we pin an Excel range … Continue reading Analyse Power BI Data in Excel. The post Analyse Power BI Data in Excel appeared first on BI Insight.
In a world where uncertainty and change are constant, scenario planning empowers companies with the agility and competitive edge needed to thrive. Download the toolkit to fortify your business strategy , set up your competitive positioning , and ensure your company is poised to respond to any future scenario.
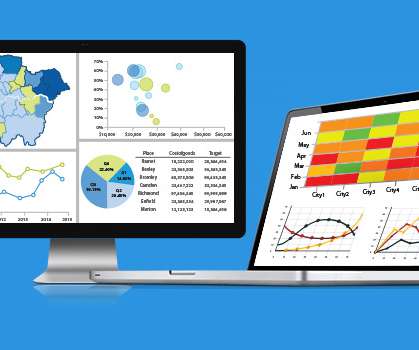
It’s no secret that organizations are swimming in data. And when you’re not a data expert, it’s easy to get lost in the sea of information. A useful, well-designed dashboard makes all the difference. Dashboards allow even the least tech-savvy users to make better business decisions. But when creating a dashboard, it’s simply not enough to list all […].
Does this sound familiar: Your company decided to be data-driven, so you’re pulling data from multiple sources and drowning in it, trying to figure out what’s important. If so, you’re not alone! Many businesses are overwhelmed with data overload. In fact, in its Guide to Business Dashboards, Klipfolio reported that “managing and extracting real value […].
Tableau is a business intelligence (BI) solution with three products. Each product is priced differently. Additional vendors resemble Tableau products as well and have their own unique pricing packages. How is Tableau Priced? Here are details on Tableau’s three solution products and the associated costs for each: Tableau Desktop: This package applies to any individual user. […].
Better Buys has announced its 2Q 2016 Editor’s Choice Award winners for its office equipment devices. These winners represent the top manufacturers in the industry and were compiled from in-depth analysis of recently-released office equipment products. Each award recipient not only offered the greatest value and functionality but also exhibited unique features.
Whether your organization is at the start of its sustainability and impact journey or years into it, many brands share a common concern: the uncertainty of whether they are sending stakeholders mixed messages. Creating content that speaks to your audience's “love language” can be a tricky dance. But, worry not! 3BL has put together tips to ensure that your content not only finds its rhythm but also resonates with your target audiences.
Did you know: In 2014, organizations were spending an average of $1,229 and 32.4 hours per employee on learning? That’s according to the Association of Talent Development’s State of the Industry report. It’s well known that training employees and providing professional development is expensive. But short changing your employees’ development can hurt your company in […].
We organize all of the trending information in your field so you don't have to. Join 11,000+ users and stay up to date on the latest articles your peers are reading.
You know about us, now we want to get to know you!
Let's personalize your content
Let's get even more personalized
We recognize your account from another site in our network, please click 'Send Email' below to continue with verifying your account and setting a password.


.jpg)


Let's personalize your content