This site uses cookies to improve your experience. To help us insure we adhere to various privacy regulations, please select your country/region of residence. If you do not select a country, we will assume you are from the United States. Select your Cookie Settings or view our Privacy Policy and Terms of Use.
Cookie Settings
Cookies and similar technologies are used on this website for proper function of the website, for tracking performance analytics and for marketing purposes. We and some of our third-party providers may use cookie data for various purposes. Please review the cookie settings below and choose your preference.
Used for the proper function of the website
Used for monitoring website traffic and interactions
Cookie Settings
Cookies and similar technologies are used on this website for proper function of the website, for tracking performance analytics and for marketing purposes. We and some of our third-party providers may use cookie data for various purposes. Please review the cookie settings below and choose your preference.
Strictly Necessary: Used for the proper function of the website
Performance/Analytics: Used for monitoring website traffic and interactions
Overall, unsupervised algorithms get to the point of unspecified data bits. Clustering – Exploration of Data. Cluster analysis is aimed at classifying objects into groups called clusters on the basis of the similarity criteria. Overall, clustering is a common technique for statistical dataanalysis applied in many areas.
Even if AI replaces some routine job functions, like pulling together information and writing a basic dataanalysis report, a person will still need to review it and extract insights, he says. Watt wants the department to develop a range of AI skills to be prepared for the changes coming to his company. “We
SplashBI is recognized as a Leader in Everest Group’s 2024 People Analytics Platform PEAK Matrix® Assessment [Duluth, Georgia, 11th April] – SplashBI has been recognized as one of the Leaders in Everest Group’s 2024 People Analytics Platform PEAK Matrix® Assessment. April 10, 2024
This blog digs deep into the exploratory dataanalysis of Office Depot's product data to explore fascinating insights. This analysis provides a clearer understanding of how brand and manufacturer choices influence overall pricing dynamics. Thermal and Dot Matrix Printers Average Costs: $909.26 BELKIN, INC.
Competitor analysis helps companies make better strategic decisions and rise to the top. Below, you’ll read about some of the tools that you can use for data extraction and monitoring in competitive analysis projects. You can use the built-in competitor analysis features to get simple visualizations without complication.
Accordingly, the rise of master data management is becoming a key priority in the business intelligence strategy of a company. Today, most companies understand the impact of data quality on analysis and further decision-making processes and hence choose to implement a data quality management (DQM) policy, department, or techniques.
6) Data Quality Metrics Examples. 7) Data Quality Control: Use Case. 8) The Consequences Of Bad Data Quality. 9) 3 Sources Of Low-Quality Data. 10) Data Quality Solutions: Key Attributes. The data quality analysis metrics of complete and accurate data are imperative to this step.
To engage your audience, whether internal or external, consider putting your data into some of today’s more popular data visualizations. The magic quadrant, often called the 2×2 matrix or the four-blocker, is great for reporting differences (i.e. opposites) or data points across two ranging scales.
Pandas is a powerful Python library for dataanalysis and manipulation. It’s commonly used in machine learning applications for preprocessing data, as it offers a wide range of features for cleaning, transforming, and manipulating data. Seaborn is a Python library for creating statistical graphics.
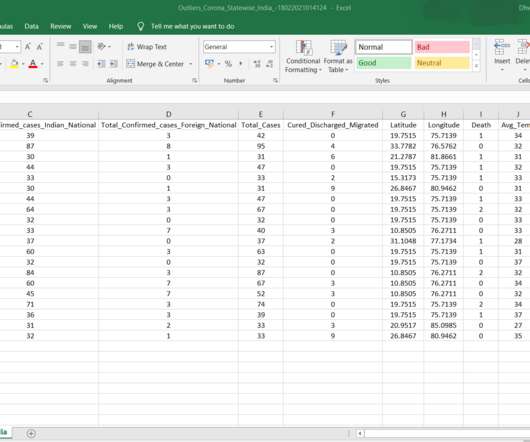
Outliers, also referred to as anomaly, exception, irregularity, deviation, oddity, arise in dataanalysis when the data records differ dramatically from the other observations. In layman’s terms, an outlier can be interpreted as any value that is numerically far-flung from most of the data points in a sample of data.
In contrast, efficiency techniques such as low-rank adaption (LORA), federated learning, matrix decomposition, weight sharing, memory optimization, and knowledge distillation are all being utilized to optimize models for specific use cases at the edge.
Predicting housing prices using dataanalysis tools like Python has become popular with real estate investors. The concept is simple — use historical data from the past, apply predictive analytics models such as Machine Learning, and predict future housing prices. Looking to acquire data sets for similar analysis?
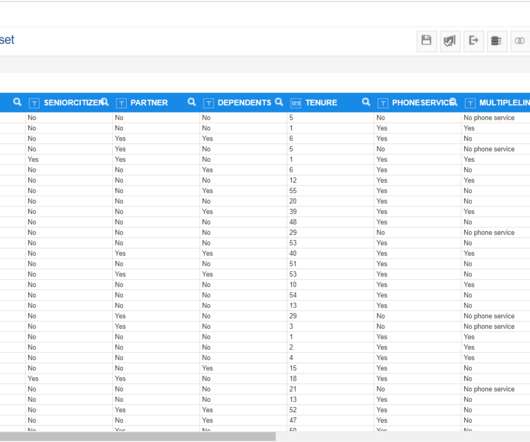
Any kind of analysis initiates by looking upon the data. Keeping a note that we already have a predefined dataset uploaded to Smarten, let’s get started slowly but surely into how to open a loaded dataset in Smarten and make analysis. Smarten has provided apt pop-ups if our data is not sustainable for the algorithm selection.
In contrast, efficiency techniques such as low-rank adaption (LORA), federated learning, matrix decomposition, weight sharing, memory optimization, and knowledge distillation are all being utilized to optimize models for specific use cases at the edge.
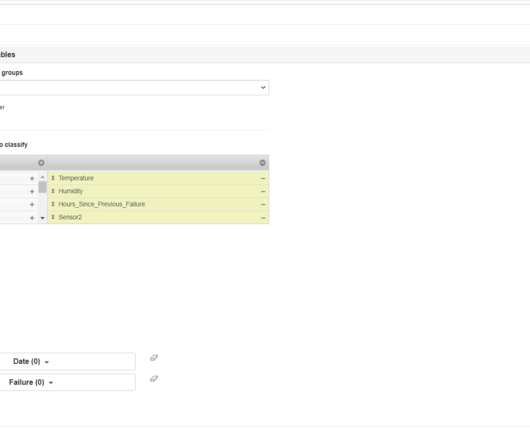
Better the data, Profound is the insight! Now that we have a broader understanding of the machine maintenance use case, the next apparent step is to comprehend the data needed for exploratory analysis. If we have data, let’s look at it! Any kind of analysis initiates by looking upon the data.
For more insights on the historic data (2017 to 2021) and forecast market size (2023 to 2027) – Request a sample report What’s New? Customization purview If our report has not included the data that you are looking for, you can reach out to our analysts and get segments customized. Alan SA, Anywhere 2 go Co. Overview 11.2
And this was clear in a recent webinar hosted by SCIP as two NetBase Quid data experts, Alexis Nigro and Harvey Ranola, walked the audience through enriching their market research with deep-level dataanalysis. This analysis compares the product sales of various competing brands across different retail channels.
We organize all of the trending information in your field so you don't have to. Join 11,000+ users and stay up to date on the latest articles your peers are reading.
You know about us, now we want to get to know you!
Let's personalize your content
Let's get even more personalized
We recognize your account from another site in our network, please click 'Send Email' below to continue with verifying your account and setting a password.


Let's personalize your content