This site uses cookies to improve your experience. To help us insure we adhere to various privacy regulations, please select your country/region of residence. If you do not select a country, we will assume you are from the United States. Select your Cookie Settings or view our Privacy Policy and Terms of Use.
Cookie Settings
Cookies and similar technologies are used on this website for proper function of the website, for tracking performance analytics and for marketing purposes. We and some of our third-party providers may use cookie data for various purposes. Please review the cookie settings below and choose your preference.
Used for the proper function of the website
Used for monitoring website traffic and interactions
Cookie Settings
Cookies and similar technologies are used on this website for proper function of the website, for tracking performance analytics and for marketing purposes. We and some of our third-party providers may use cookie data for various purposes. Please review the cookie settings below and choose your preference.
Strictly Necessary: Used for the proper function of the website
Performance/Analytics: Used for monitoring website traffic and interactions
A well-researched and informative competitor analysis report is the key to uncovering detailed insights into your competitors' operations, helping you strategize effectively. Without a well-researched and informative analysis, businesses risk falling behind. What is a competitor analysis report?
Want to make smarter decisions for your business? Context analysis might be just what you need! Context analysis, also known as contextual analysis, examines industry trends, competitors, and market opportunities to provide a complete picture. This approach is key for making smart choices in business and other fields.
The cloud version of Tableau, for instance, allows non-technical team members to use native “connectors” to import data sources like Salesforce, QuickBooks and Amazon Seller Central, helping merchants visualize data based on historical sales figures. Performing Analysis in Natural Language.
For years, spreadsheet programs like Microsoft Excel, Google sheet, and more sophisticated programs like Microsoft Power BI have been the primary tools for data analysis. For example, marketing managers can run a cluster analysis to segment customers by their buying pattern or preferences. Predictive analytics.
This type of analysis helps you make better business decisions based on trends and patterns. Big data analytics can also help you identify trends in your industry and predict future sales. Big data management increases the reliability of your data. Big data management has many benefits. Conclusion.
One analysis found that the market for AI in the profession is expected to be worth over $600 million within the next three years. In the contemporary and fiercely competitive businessenvironment, offering an individualized customer encounter is no longer merely a pleasant addition; it has become an essential requirement.
Yet, historically, getting the CEO, CFO, or even the CTO to engage early in the sales process—if at all—has been a long shot. Chorus.ai’s analysis of more than 500,000 recent sales meetings conducted by more than 100 of our clients in 10 major industries. The following 12 tips can help ensure that you and your team are.
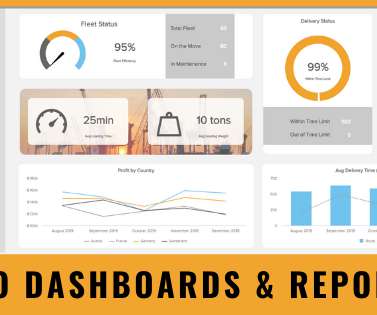
and looked at a definitive dashboard definition, it’s time to explore the six key benefits of using these online data analysis tools within your business. To help guide your dashboard development efforts, here is a quick rundown of the most powerful chart types for digital dashboards in a businessenvironment: Bar charts.
In our cutthroat digital age, the importance of setting the right data analysis questions can define the overall success of a business. That being said, it seems like we’re in the midst of a data analysis crisis. Your Chance: Want to perform advanced data analysis with a few clicks?
As a global business we rely on data to drive multiple business functions. ZoomInfo’s platform is fantastic — it’s the best tool for sales/cold business development. I’ve used it to close significant new business deals within my region.
On the ZoomInfo blog we often discuss the use of data in sales, marketing, and recruiting. Large companies have the means to fund complex research studies, run advanced data analysis, or partner with other companies, while smaller organizations are often left to gather and analyze data on their own. Enter, Data-Driven Public Relations.
Competition for experienced sales professionals has never been more intense, and it’s likely to remain a strongly candidate-driven market for at least the foreseeable future. Here’s how sales leaders can maximize the impact of their existing sales teams and survive in today’s highly competitive labor market.
In other words, gathering competitive intelligence lets you make better decisions by studying your competitors and the businessenvironment that surrounds it. How a business can identify their main competitors. That’s why making a win/loss analysis should become a part of your marketing strategy. Who’s calling?
This leads to creating a business strategy that will help you outperform competitors by selling more and earning higher revenue than them. Source According to Crayon’s 2024 State of Competitive Intelligence Report , 65% of sales opportunities are competitive. One of the best ways to proceed is with a SWOT analysis.
And when it comes to finding actionable answers to specific questions, ad hoc analysis and reporting are essential. Moreover, a host of ad hoc analysis or reporting platforms boast integrated online data visualization tools to help enhance the data exploration process. What Is Ad Hoc Analysis?
A competitive intelligence agency does more than just monitor your direct competitors – their research looks into a wider panorama of your businessenvironment. This includes things like trend analysis, disruptive innovations, and even subtle shifts in the socio-political landscape that could impact your industry.
In determining the best fit for your organization, it is important that you consider the way in which a particular business intelligence tool satisfies your forecasting and predictive analysis needs. There is perhaps no other single factor that will affect your business future and growth as significantly as predictive analysis.
Yet, historically, getting the CEO, CFO, or even the CTO to engage early in the sales process — if at all — has been a long shot. Chorus’ analysis of more than 500,000 sales meetings conducted by more than 100 clients in 10 major industries. The following 12 tips can help ensure that you and your team are. What is significant?
We have written about management reporting methods that can be utilized in the modern practice of creating powerful analysis, bringing complex data into simple visuals, and employ them to make actionable decisions. But first, let’s begin with a general understanding of key metrics and their usage in business.
Driving Agility in Uncertainty The global businessenvironment continues to be characterized by uncertainty and rapid change. CDOs empower organizations to adapt faster through comprehensive data analysis and scenario modeling.
Just as marketers capture and convert leads into sales with targeted content, creative recruiters can use the same tactics to grow and nurture their talent pool. Attract candidates with these five SEO tips: Complete a keyword analysis : Ask yourself: How popular are certain job titles? 5. Nurture job candidates.
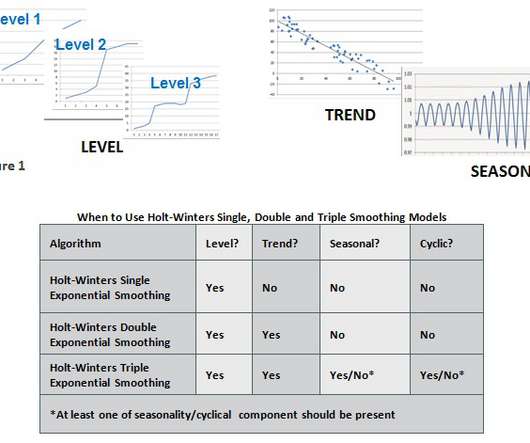
This article provides a brief explanation of the Holt-Winters Forecasting model and its application in the businessenvironment. For more information about data trend and pattern analysis techniques, read our article entitled, ‘ What Are Data Trends and Patterns, and How Do They Impact Business Decisions?’
In the recent years, dashboards have been used and implemented by many different industries, from healthcare, HR, marketing, sales, logistics, or IT, all of which have experienced the importance of dashboard implementation as a way to reduce cost and increase the productiveness of their respected business. Have no fear!
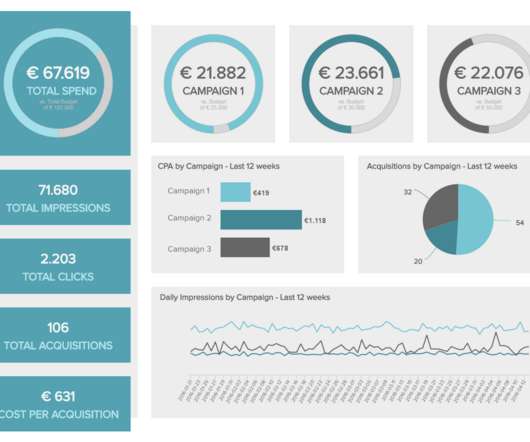
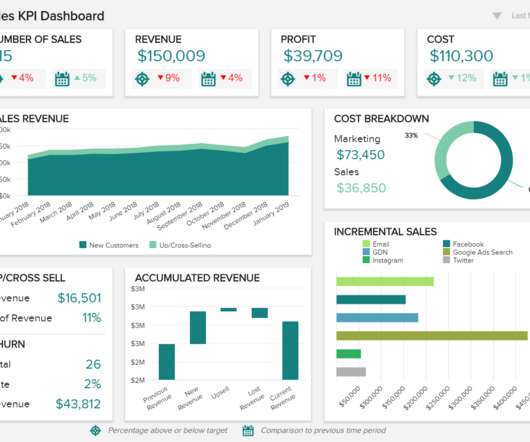
In your daily business, many different aspects and ‘activities’ are constantly changing – sales trends and volume, marketing performance metrics, warehouse operational shifts, or inventory management changes. All your financial analysis can be integrated into a single visual. Sales KPI dashboard. click to enlarge**.
These are some of the statistics that we came across illustrating the place of and developments in competitive intel in today’s businessenvironment: Competitive intel (CI) increases the likelihood of success. According to studies, more than 75% of new businesses don’t see their 15 th year. Competitive intel uses powerful tools.
The journey to understand customer insights calls for a proper analysis of the data gathered. Without this step, businesses don’t really have anything to show for their research efforts. Customer sentiment analysis. To perform customer sentiment analysis , you need a sentiment analysis tool. Competitor analysis.
Big data plays a crucial role in online data analysis , business information, and intelligent reporting. Spreadsheets no longer provide adequate solutions for a serious company looking to accurately analyze and utilize all the business information gathered. Customer analysis and behavioral prediction. click to enlarge**.
Effective decision-making processes in business are dependent upon high-quality information. That’s a fact in today’s competitive businessenvironment that requires agile access to a data storage warehouse , organized in a manner that will improve business performance, deliver fast, accurate, and relevant data insights.
They come in handy to manage the results, but also the most important aspect of any analysis: the presentation of said results, without which it becomes hard to make accurate, sound decisions. Any market analysis report example worth its salt will allow everyone to get a firm grip on their results and discoveries on a single page, with ease.
By setting themselves apart, they can attract a customer base that they hope to keep for a long time rather than attract one-off sales. The Tools Businesses Need to Perform a Competitive Audit. Website analysis. Website analysis tools can help you determine how much effort they have put into their sites. Content analysis.
And this is the exact opposite of what needs to happen in today’s consumer-driven businessenvironment. And its steps include the collection, analysis, and interpretation of market data. Our Intelligence Connector is a lifesaver for brands capturing large quantities of intel for ongoing research and analysis.
Competitive intelligence is the process of observation, data collection, and analysis of external businessenvironments, which yield critical information allowing the observer to make effective business adjustments. Gone are the days when sales figures told the bulk of the story. Competitive Intelligence Defined.
During the critical period of business expansion, it is more important than ever to have integrated, concise information with which to make product and service decisions, pricing and financial decisions and customer targeting decisions. Multi-layered access rights and permissions provide appropriate data and personal security.
No matter the size of the organization, no business manager wants to spend money needlessly and no business wants to operate in an environment of confusion or guess at results and the potential for future success. Even in the smallest businessenvironment, your competition may include large enterprises.
Discover how SplashBI transforms your approach to financial analysis, integrating seamlessly with your Oracle ERP system from day one. SplashBI’s pre-configured Financial Analysis Dashboards are here to refine your month-end reviews, expenditure analysis, customer performance evaluations, and project cost monitoring.
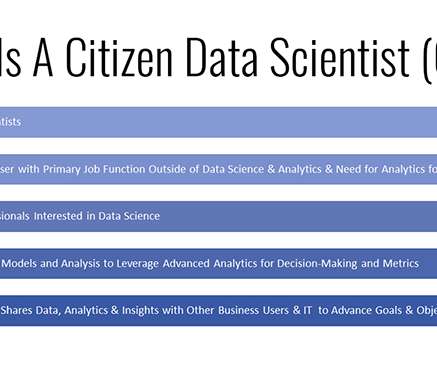
Citizen Data Scientists represent a new breed of business analysts – a group of individuals with diverse business responsibilities and training, who wield sophisticated analytical tools, and employ complex methods of analysis to improve business results – all without the training or assistance of data scientists or IT team members.
2) Benefits Of White Label Reports 3) Key White Label Reporting Features 4) White Label Dashboards & Report Examples In today’s competitive businessenvironment, building a brand that is trusted, recognizable, and loved by many is not an easy task. Table of Contents 1) What Are White Label Reports? The answer is white labeling.
As visualized data presents itself, real time analysis empowers the user to draw swift conclusions that are both informed and accurate. By focusing on real time analysis, it’s possible to spot emerging trends and pounce on them or prevent detrimental issues before they occur (or get out of control). Primary KPIs: Sales By City.
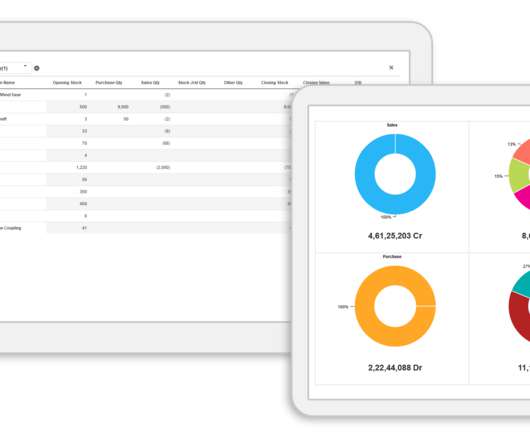
The Tally ERP Solution is a popular accounting and financial application used by many business professionals for day-to-day data entry and reporting. Business users have become very familiar with this application and they use it to fulfill their responsibilities.
In the fast-paced, competitive business world, having a reliable strategy is crucial. Battle Cards serve as the go-to tools for sales teams, offering insights into competitors and helping organizations navigate their industries. Expert analysis for foresight Draw on expert analysis for a forward-looking perspective.
Get a competitive advantage: Probably one of the most appealing benefits of business intelligence is the fact that it gives a competitive advantage. Taking the time to plan and organize an efficient BI strategy will skyrocket your business performance. In today’s crowded businessenvironment, everyone wants to work with data.
The requirement to stay agile in today’s businessenvironment is of utmost importance if you want to obtain success. SaaS tools enable you to choose the best delivery model that corresponds with your business requirements and adapt it as your business changes. Data analysis like never before.
In today’s businessenvironment, most organizations are overwhelmed with data and looking for a way to tame the data overload and make it more manageable to help team members gather and analyze data and make the most of the information contained within the walls of the enterprise. Data Lake.
These visual representations of data deliver information in real-time and create a time-saving businessenvironment where COOs can focus on other critical tasks rather than investing countless hours into exporting and manipulating static spreadsheets. The dashboard starts with the inventory to sales ratio and evaluates the overstock.
We organize all of the trending information in your field so you don't have to. Join 11,000+ users and stay up to date on the latest articles your peers are reading.
You know about us, now we want to get to know you!
Let's personalize your content
Let's get even more personalized
We recognize your account from another site in our network, please click 'Send Email' below to continue with verifying your account and setting a password.


Let's personalize your content