This site uses cookies to improve your experience. To help us insure we adhere to various privacy regulations, please select your country/region of residence. If you do not select a country, we will assume you are from the United States. Select your Cookie Settings or view our Privacy Policy and Terms of Use.
Cookie Settings
Cookies and similar technologies are used on this website for proper function of the website, for tracking performance analytics and for marketing purposes. We and some of our third-party providers may use cookie data for various purposes. Please review the cookie settings below and choose your preference.
Used for the proper function of the website
Used for monitoring website traffic and interactions
Cookie Settings
Cookies and similar technologies are used on this website for proper function of the website, for tracking performance analytics and for marketing purposes. We and some of our third-party providers may use cookie data for various purposes. Please review the cookie settings below and choose your preference.
Strictly Necessary: Used for the proper function of the website
Performance/Analytics: Used for monitoring website traffic and interactions
Salesforce is updating its Data Cloud with vector database and Einstein Copilot Search capabilities in an effort to help enterprises use unstructured data for analysis. Artificial Intelligence, BusinessIntelligence and Analytics Software, CRM Systems, Databases, Enterprise Applications
More and more often, businesses are using data to drive their decisions — which makes cutting-edge analytics and businessintelligence strategies one of the best advantages a company can have. Here are the six trends you should be aware of that will reshape businessintelligence in 2020 and throughout the new decade.
It comprises the processes, tools and techniques of data analysis and management, including the collection, organization, and storage of data. The chief aim of data analytics is to apply statistical analysis and technologies on data to find trends and solve problems. It is frequently used for risk analysis.
Data science is a method for gleaning insights from structured and unstructured data using approaches ranging from statistical analysis to machine learning. Data scientists say that investigating something with data is simply analysis. Data science takes analysis another step to explain and solve problems. What is data science?
The majority of machine learning and deep learning solutions have focused on fundamental analysis of securities. However, deep learning and other artificial intelligence technologies will also change the future of technical analysis as well. A number of experts have started analyzing the role of AI in technical analysis.
Organisations still struggle to connect the algorithms they are building to a business value proposition, which makes it difficult for IT and business leadership to justify the investment it requires to operationalise models.”. AI also requires substantial IT skills, and Australia faces a deepening skills crisis around this.
The interdisciplinary field of data science involves using processes, algorithms, and systems to extract knowledge and insights from both structured and unstructured data and then applying the knowledge gained from that data across a wide range of applications. BusinessIntelligence Developer. Machine Learning Scientist.
The final results of a data scientist’s analysis must be easy enough for all invested stakeholders to understand — especially those working outside of IT. A data scientist’s approach to data analysis depends on their industry and the specific needs of the business or department they are working for. Data scientist salary.
We have nesting algorithms to help with that. AI and sophisticated numerical analysisalgorithms are used to minimize material waste, which adds up to big money when large volumes are involved. Computer aided design (CAD) tools, which are often used to model the irregular shapes, can feed the models to the nesting algorithms.
It is an interdisciplinary field, combining computer science, statistics , mathematics, and businessintelligence. This involves data collection , data cleaning, data analysis, and data interpretation. Data Analysis The cleaned data is then analyzed using various statistical techniques and algorithms.
The answer lies in the utilization of AI and machine learning technology to assist with all of the steps associated with using data from collection to analysis. AI (artificial intelligence) software utilizes advanced algorithms and frameworks to allow computers to utilize reason and learn from the data that it comes into contact with.
Government agencies and nonprofits also seek IT talent for environmental data analysis and policy development. Government agencies and nonprofits are looking for data scientists and engineers to help with climate modeling and environmental impact analysis.
By applying the right data management, propensity-based analytics, ML, and businessintelligence tooling, Dangson says his team realized in 2021 that Equinix would be able to analyze data from channel partners and end customers to pinpoint which customers were best served directly via Equinix sales versus indirectly via partners and resellers.
Predictive analytics, sometimes referred to as big data analytics, relies on aspects of data mining as well as algorithms to develop predictive models. These statistical models are growing as a result of the wide swaths of available current data as well as the advent of capable artificial intelligence and machine learning.
The application of Artificial intelligence and BusinessIntelligence in affiliate marketing has been actively discussed for quite a time. In AI it refers to computer intelligence, while in BI it is about smart decision-making in business influenced by data analysis and visualization. BusinessIntelligence.
Big data plays a crucial role in online data analysis , business information, and intelligent reporting. Spreadsheets no longer provide adequate solutions for a serious company looking to accurately analyze and utilize all the business information gathered. Online businessintelligence and reporting are closely connected.
The introduction of data collection and analysis has revolutionized the way teams and coaches approach the game. It has transformed into an arena where data-driven decisions and analysis play a pivotal role. The Role of Data Collection in Game Analysis Data collection in football serves as a powerful tool for game analysis.
Big Data’s most effective strategies identify business requirements first, and then leverage existing infrastructure, data sources and analytical solutions to support the business opportunity. Customer-focused analysis dominates Big Data initiatives. Variables Financial Industry Uses in its Big Data Algorithms.
1) Benefits Of BusinessIntelligence Software. 2) Top BusinessIntelligence Features. For a few years now, BusinessIntelligence (BI) has helped companies to collect, analyze, monitor, and present their data in an efficient way to extract actionable insights that will ensure sustainable growth.
The global businessintelligence and analytics software application market is expected to be valued at over $18 billion by 2025. A SWOT analysis can help assess a business unit, product, service, or whole company. A SWOT analysis can help assess a business unit, product, service, or whole company.
In our cutthroat digital age, the importance of setting the right data analysis questions can define the overall success of a business. That being said, it seems like we’re in the midst of a data analysis crisis. Your Chance: Want to perform advanced data analysis with a few clicks?
These platforms offer robust capabilities for managing tickets and customer requests, making them indispensable tools for various businesses and organizations. Both of these platforms have complex analytics algorithms that help technical support professionals offer higher quality service. Zendesk offers robust reporting capabilities.
Some examples of the projects you could undertake with help from Ludwig include text or image classification, machine-based language translation and sentiment analysis. In addition to supporting standard SQL, Apache Drill lets you keep depending on businessintelligence tools you may already use, such as Qlik and Tableau.
By gaining the ability to understand, quantify, and leverage the power of online data analysis to your advantage, you will gain a wealth of invaluable insights that will help your business flourish. 5) “Python for Data Analysis: Data Wrangling With Pandas, NumPy and IPython” by Wes McKinney. At present, around 2.7
What on earth is Plug n’ Play Predictive Analysis? It IS a surprisingly simple businessintelligence tool that can help you plan, predict, see patterns and trends and allow the average business user to function at a higher level with concise information that will help users to make good decisions.
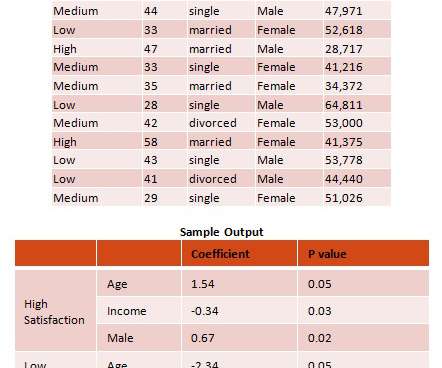
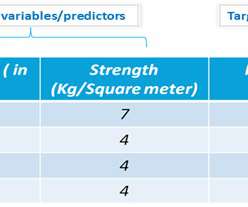
This article provides a brief definition of the multinomial-logistic regression classification algorithm and its uses and benefits. What is the Multinomial-Logistic Regression Classification Algorithm? How Does One Use the Multinomial-Logistic Regression Classification Algorithm? About Smarten.
In the age of data, businessintelligence is about more than just having the right information — it’s about uncovering and analyzing the exact crucial insights you need to help inform business decisions, stay ahead of market-moving trends, and keep an edge on the competition. That’s where market analysis tools come in.
Dashboard Software and BusinessIntelligence For Every User. If you want your business to be successful today and tomorrow you must accurately forecast the market, competition and buying behavior of customers. Predict your future with BusinessIntelligence Forecasting. Get in touch with us to know more.
This article summarizes our recent article series on the definition, meaning and use of the various algorithms and analytical methods and techniques used in predictive analytics for business users, and in augmented data preparation and augmented data discovery tools. Use Case(s): Weather Forecasting, Fraud Analysis and more.
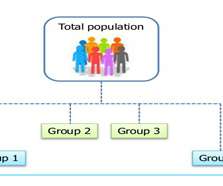
This article provides a brief explanation of the KMeans Clustering algorithm. What is the KMeans Clustering algorithm? Once the algorithm has been run and the groups are defined, any new data can be easily assigned to the correct group. How Does an Enterprise Use the KMeans Clustering Algorithm to Analyze Data?
One of the key data sets is 10 years’ worth of hospital admissions records, which data scientists crunched using “time series analysis” techniques. Then, they could use machine learning to find the most accurate algorithms that predicted future admissions trends. 2) Electronic Health Records (EHRs).
Your Business Will Soar with Self-Serve Data Prep & Predictive Analysis Software. If your organization is implementing self-serve businessintelligence, it is important to balance sophisticated tools with the skills of the average business user.
Nearly every organization has BI tools, but not every organization takes the Smarten approach to businessintelligence. The Smarten approach to businessintelligence is reflected in the ElegantJ BI solution and its innovative approach to self-serve BI tools. Find out more about Smarten now!
To accurately predict and plan, every enterprise must select a businessintelligence solution that will support their efforts and provide business users with a rich set of features and tools. Why and how might an enterprise use Plug n’ Play Predictive Analysis?
Many organizations have grown comfortable with their businessintelligence solution, and find it difficult to justify the need for advanced analytics. How is Advanced Analytics Different from BusinessIntelligence? Advanced Analytics is the logical tool to help a business optimize its investments and achieve its goals.
Whether your business is a small, single location brick and mortar enterprise or a large, multi-facility organization that spans the global market, you need access to sophisticated, easy-to-use businessintelligence tools in order to compete in local, regional and global markets. Original Post : Plug n’?
From customer insights and lead capture to businessintelligence and beyond, a high-quality data flywheel is the essential system that makes efficient growth possible. A strong data management framework combines data governance, quality control, security, analysis and automation to make sure data is both accurate and reliable.
In this article, we will discuss the KNN Classification method of analysis. What is the KNN Classification Algorithm? The KNN (K Nearest Neighbors) algorithm analyzes all available data points and classifies this data, then classifies new cases based on these established categories. How Can KNN Classification Help an Enterprise?
Let’s take a closer look at Augmented Analytics and talk about why it has gotten so much attention in the businessintelligence world. The augmented analytics approach provides tools for better clarity and insight into and, as this approach evolves, it continues to change and disrupt the more traditional forms of analysis.
ElegantJ BI, a leading vendor in BusinessIntelligence and Advanced Analytics solutions, is pleased to announce that it is listed for its suite in the Gartner ‘Other Vendors to Consider for Modern BI and Analytics’ report published August 4, 2017.
The centerpiece of the announcement is that the software giant “will retire facial analysis capabilities that purport to infer emotional states and identity attributes such as gender, age, smile, facial hair, hair, and makeup.” Moving Away from Facial Analysis. Also read: What Does Explainable AI Mean for Your Business?
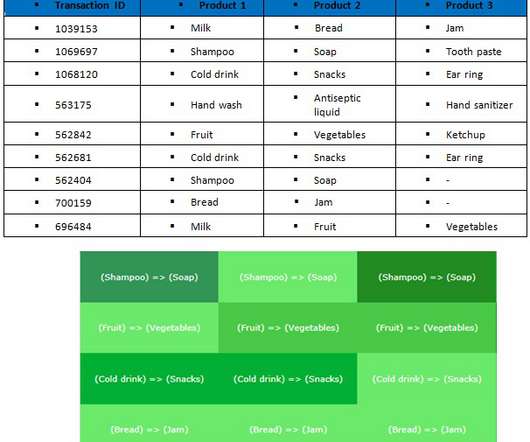
What is the FP Growth Algorithm? Frequent pattern mining (previously known as Association) is an analytical algorithm that is used by businesses and, is accessible in some self-serve businessintelligence solutions. This article provides a brief explanation of the FP Growth technique of Frequent Pattern Mining.
If utilized correctly, data offers a wealth of opportunity to individuals and companies looking to improve their business’ intelligence, operational efficiency, profitability, and growth over time. And when it comes to finding actionable answers to specific questions, ad hoc analysis and reporting are essential.
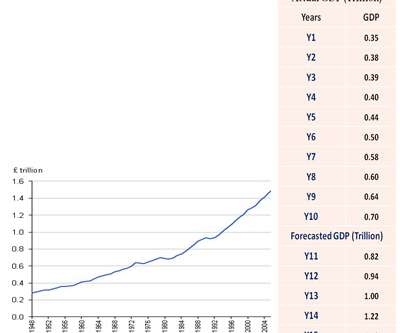
This article looks at the ARIMAX Forecasting method of analysis and how it can be used for businessanalysis. For more information about data trend and pattern analysis techniques, read our article entitled, ‘ What Are Data Trends and Patterns, and How Do They Impact Business Decisions?’ About Smarten.
We organize all of the trending information in your field so you don't have to. Join 11,000+ users and stay up to date on the latest articles your peers are reading.
You know about us, now we want to get to know you!
Let's personalize your content
Let's get even more personalized
We recognize your account from another site in our network, please click 'Send Email' below to continue with verifying your account and setting a password.


Let's personalize your content